
Summary
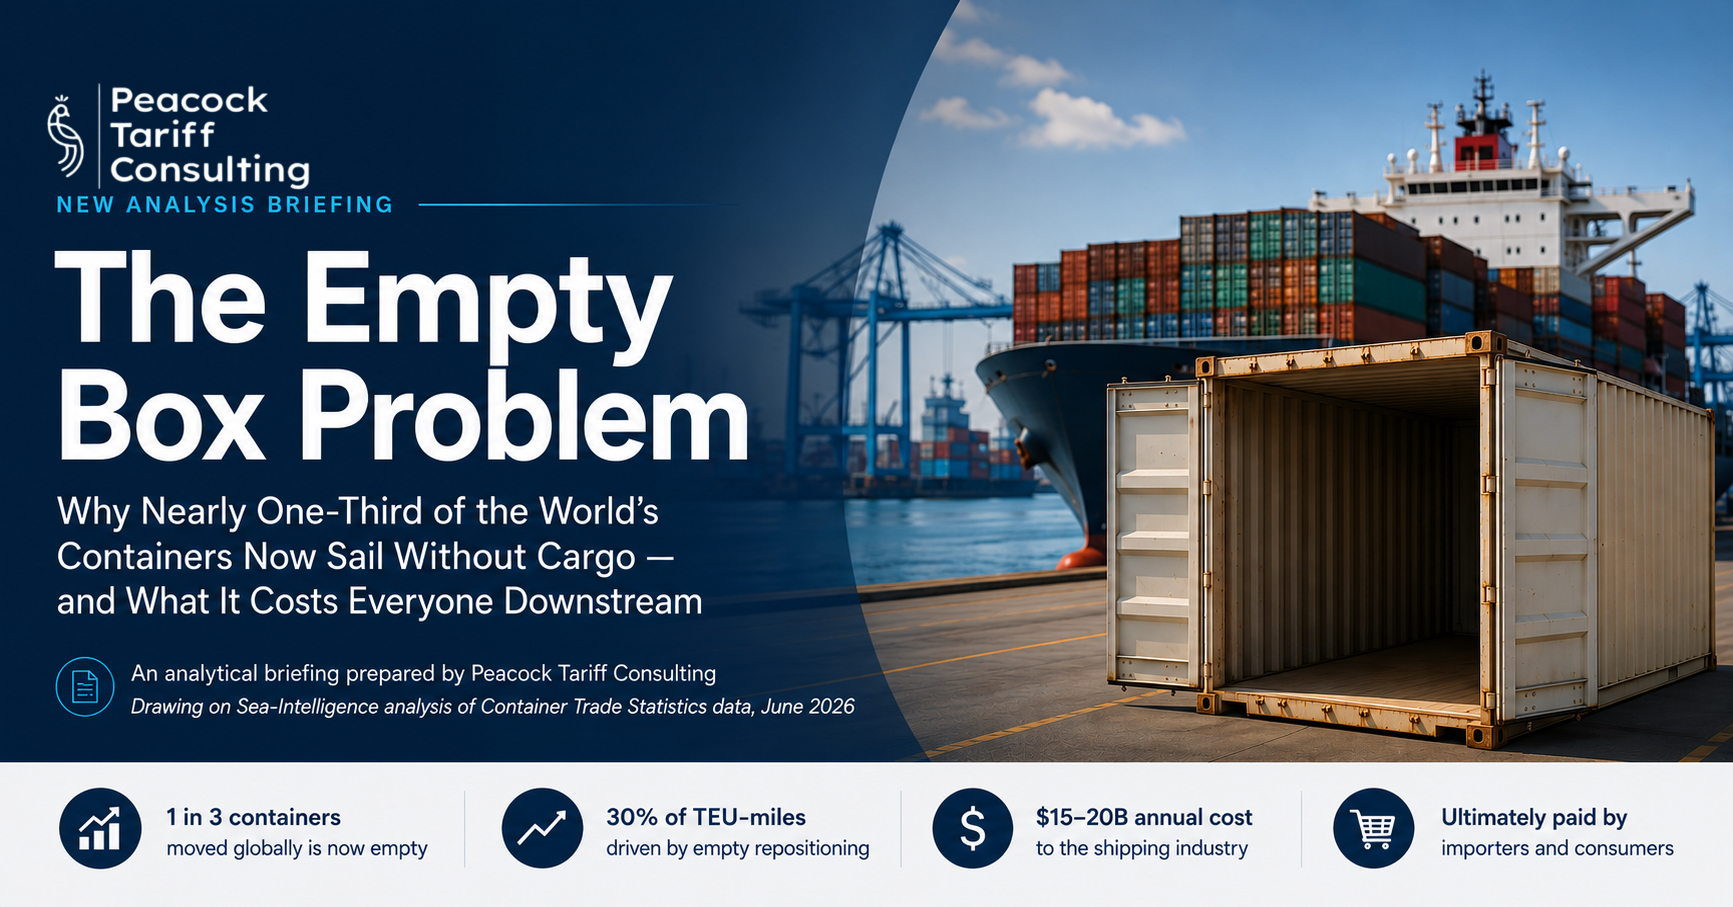
Container shipping has always carried a hidden inefficiency: a box that moves cargo in one direction must somehow get back to where the next load originates. For most of the industry’s modern history, that return leg was an accepted cost of doing business, balanced reasonably well by two-way trade. That balance has now broken down. New analysis from the Danish consultancy Sea-Intelligence, based on Container Trade Statistics (CTS) data, finds that roughly one in every three containers moved around the world today is empty a marked deterioration from one in four before the pandemic. Measured by the work actually performed at sea, in TEU-miles, empty repositioning now accounts for around 30 percent of all global container shipping activity, up from 24 percent in the pre-pandemic baseline.
The shift is not a statistical artifact or a temporary distortion. Sea-Intelligence has explicitly modelled a “Suez-normal” scenario and concluded that, for all practical purposes, the Red Sea diversions no longer explain the trend. What remains, once the routing noise is stripped out, is a structural widening of global trade imbalances. The number of empty containers needing repositioning has grown by roughly 65 percent since the first quarter of 2019, while loaded volumes have grown by only about 17 percent. The empties are not keeping pace with trade they are outrunning it.
This briefing explains what the figures mean, why they have moved, and most importantly for shippers, importers, and the consumers at the end of the chain what the trend costs. The short version is that the bill is large, growing, and ultimately paid by the buyers of goods. Empty repositioning is widely estimated to cost the liner industry somewhere between fifteen and twenty billion dollars a year, equivalent to a double-digit share of carriers’ operating costs. That expense does not evaporate. It is loaded onto the freight rates charged on the busy, cargo-rich head-haul lanes, and from there it works its way into landed costs, wholesale prices, and the shelf. The concluding section quantifies this cascade and shows how the empty-box problem becomes, in the end, a consumer-price problem.
The Headline Finding
The simplest way to state the finding is also the most arresting: today, for every two loaded containers that move across the world’s oceans, there is roughly one empty container moving alongside them with nothing inside. Sea-Intelligence’s reading of CTS data, smoothed with a twelve-month rolling average to strip out seasonal swings, puts the ratio of empties to full boxes at about one-in-three. Before the pandemic, the same measure sat closer to one-in-four. In the space of a few years, the industry has added an entire extra increment of unproductive movement to its baseline workload.
The absolute numbers underscore the scale. On a rolling basis, the volume of empty containers requiring repositioning has climbed from roughly 3 million TEU per month to about 4.5 million TEU per month over a seven-year window an increase of around 50 percent in the raw monthly tally of empties that carriers must shuffle from surplus regions back to deficit ones. Across a full year, the global system moves on the order of tens of millions of empty boxes, a figure long estimated at around 60 million container moves annually even before the recent deterioration.
Sea-Intelligence is careful to frame the absolute number against the volume of loaded cargo, because a rising empty count would be unremarkable if loaded trade were rising just as fast. It is not. When empties are expressed as a share of loaded volumes, the figure has risen from roughly 22 percent before the pandemic to about 28 percent by January 2026. In other words, the empty problem is growing faster than the business that generates it. That divergence is the heart of the story, and it is why analysts describe the trend as structural rather than cyclical.
The most consequential lens, though, is distance. A container shipped empty across a short feeder route is a minor cost; a container shipped empty across an ocean is an expensive one, because it consumes the same vessel slot, fuel, and time as a loaded box would, while earning nothing. When the data are weighted by distance TEU-miles rather than TEU the picture darkens. Empty movements have risen from about 32 percent of full TEU-miles before the pandemic to roughly 42 percent by January 2026. Put plainly, for every ten loaded containers moving a given distance, the industry now drags more than four empties over comparable distances to reposition them. Sea-Intelligence calculates that carriers are now moving, by distance, roughly twice the volume of empties they moved before the pandemic.
It is worth dwelling on what that doubling means in operational terms. The world fleet of container vessels did not double over the same period; nor did the available stock of port labour, crane capacity, or inland trucking. The system has therefore absorbed a near-doubling of long-haul empty work within an infrastructure footprint that has grown far more slowly. The result is that empties now compete directly with paying cargo for the scarcest resources in the network vessel slots on the busiest lanes, berth windows at the busiest terminals, and chassis and drayage in the busiest gateways. Every empty box that wins that competition is a loaded box that must wait, and waiting has its own cost.
Why Measurement Matters: TEU, TEU-Miles, and the Share of Loaded Volume
Before going further it is worth pausing on how the empty problem is counted, because the choice of metric materially changes the headline. Three measures appear throughout the Sea-Intelligence analysis, and they are not interchangeable. Each captures a different facet of the same underlying inefficiency, and conflating them is one of the most common errors in trade-press coverage of the topic.
The first measure is the simple count of containers, expressed in TEU twenty-foot equivalent units. This is the most intuitive metric and the one behind the “one-in-three” framing. It answers the question: of all the boxes moving on ships right now, what fraction are empty? It is useful for understanding equipment flows and depot pressure, but it is blind to distance. An empty box repositioned fifty miles by barge counts the same as one repositioned eight thousand miles by deep-sea vessel.
The second measure expresses empties as a share of loaded volume rather than total volume. This is the framing that produced the move from roughly 22 percent to 28 percent. It is analytically valuable because it isolates the imbalance itself: how much empty repositioning does each unit of paying cargo now require? When this ratio climbs, it means the productive part of the business is having to subsidise a larger and larger unproductive tail.
The third and most economically meaningful measure is TEU-miles, which multiplies each container movement by the distance it travels. This is the closest proxy for the real resource cost of repositioning, because fuel burn, vessel time, and slot opportunity-cost all scale with distance. It is in TEU-miles that the trend looks most severe empties consuming around 30 percent of all shipping work, or, on the loaded-comparison basis, rising to roughly 42 percent of full TEU-miles. The gap between the count-based figure and the distance-based figure tells its own story: the empties are not only more numerous, they are increasingly being moved over longer distances, because the regions that accumulate surplus boxes are far from the regions that need them.
For shippers reading freight invoices, the TEU-mile figure is the one to watch, because it is the truest leading indicator of cost pressure. A carrier can absorb a rising count of short-haul empties; it cannot absorb a rising mountain of long-haul empties without eventually repricing the loaded cargo that pays the bills. The widening gap between the count metric and the distance metric is, in effect, an early-warning signal that the cost of the imbalance is migrating up the expensive end of the repositioning menu.
From One-in-Four to One-in-Three: The Historical Baseline
Empty repositioning is not new. It is a permanent feature of containerised trade, inherent in the fact that goods do not flow equally in both directions between any two regions. A container that carries electronics from Shanghai to Los Angeles cannot simply wait in California for a Chinese-bound load of equal value and volume; the United States does not export to China in the same containerisable quantities that it imports. So the box must be sent back, often empty, to be refilled at the export-heavy origin. This is the original sin of the container network, and the industry has lived with it since the 1960s.
What has changed is the magnitude. For years, the empty share hovered in a band that the industry treated as the cost of doing business broadly the one-in-four territory that defined the pre-pandemic norm. Regional figures historically varied widely, with empty movements making up a small share of box moves in import-heavy markets like the United States and Latin America, and a much larger share in export-heavy or structurally imbalanced markets. Older breakdowns put empty movements at roughly 15 percent of box movements in the United States, 14 percent in Latin America, 29 percent in Europe, 16 percent in the Middle East, and 25 percent in China, illustrating how unevenly the burden has always been distributed.
The pandemic era broke the old equilibrium. The surge in goods consumption in 2020 and 2021, the congestion that locked equipment in the wrong places, the scramble for boxes that sent empties chasing premium head-haul rates, and the subsequent normalisation all left the network more imbalanced than before. Crucially, when the dust settled, the empty share did not return to its old band. It settled higher. That persistence the failure to mean-revert is what distinguishes the current situation from a transient shock. The baseline itself has shifted upward.
The deterioration is concentrated where it matters most. Sea-Intelligence’s chief executive, Alan Murphy, has pointed out that the five largest deep-sea trades by volume have all seen a significant worsening in their trade imbalance compared with the pre-pandemic situation. These are precisely the long-haul corridors the trans-Pacific, Asia–Europe, and related routes where an imbalance translates into the most expensive kind of empty repositioning, because the boxes must travel the furthest to get home. A worsening imbalance on a short regional trade is an irritation; the same worsening on a trunk route spanning half the globe is a material cost event.
The Root Cause: Structural Trade Imbalance
Strip away the cyclical noise and a single force explains the trend: the world’s containerised trade flows are becoming more lopsided. Container shipping is a derived demand it exists only to serve the movement of goods and so its efficiency is hostage to the geography of production and consumption. When a region exports far more than it imports in containerisable goods, it generates a surplus of outbound full boxes and an equal and opposite deficit of inbound ones. Those boxes have to be balanced somehow, and the only way to balance them is to ship the empties back.
The classic version of this story is the imbalance between the manufacturing heartlands of Asia and the consumption centres of North America and Europe. Factories in East and Southeast Asia fill containers with finished goods bound for Western consumers; those same containers are not refilled with an equivalent volume of Western exports, because the West’s exports are disproportionately services, bulk commodities, and high-value low-volume goods that do not fill standard boxes one-for-one. The result is a permanent westbound surplus of cargo and a permanent eastbound flood of empties heading back to be refilled. As Asian export dominance has deepened and Western manufacturing has continued its long relative decline, this gap has widened rather than narrowed.
The imbalance is self-reinforcing in a way that compounds the cost. Because the head-haul direction is so much heavier than the back-haul, carriers price the two legs asymmetrically. The loaded head-haul leg commands premium rates; the back-haul is sold cheaply or moved empty. That pricing signal does little to stimulate balancing cargo, because the underlying economic geography where things are made versus where they are bought is far too large a force to be corrected by marginal freight discounts. The empties keep moving because there is simply nothing to put in them on the return.
It is worth being precise about the direction of causation. Empty repositioning is a symptom, not a disease. The disease is the imbalance in the real economy the divergence between regions that produce containerisable goods and regions that consume them. Any analysis that treats the empty-box surge as a logistics failure to be solved by better software misunderstands the problem. Better software can shave the waste at the margin, but the central driver sits in trade policy, industrial structure, and consumer demand, far upstream of the terminal gate. This is the single most important framing in the entire discussion, because it tells us where the cost ultimately comes from and where it ultimately goes.
Tariffs, Reshoring, and the Re-Drawing of Trade Maps
For firms whose business is trade policy, the most important sub-plot in the empty-container story is the role of tariffs and the broader fragmentation of global trade. Tariffs do not merely raise the price of imported goods; they redirect where goods are made and shipped, and in doing so they reshape the geography of imbalance that drives empty repositioning. The same period that produced the surge in empties has also been a period of intense tariff activity and supply-chain realignment, and the two are connected.
When tariffs fall heavily on a single origin, importers respond by shifting sourcing to alternative countries. The trade does not disappear; it relocates. A flow that once ran efficiently along a mature, relatively balanced corridor may be replaced by a newer flow along a corridor whose return-leg economics are worse, whose equipment positioning is less mature, and whose imbalance is more acute. In the transition period especially, containers pile up in the wrong places: surplus boxes accumulate at origins that have lost volume, while the new growth origins run short of equipment and must import empties to meet demand. The net effect of a major sourcing shift is, at least temporarily, more empty repositioning, not less.
There is a second-order effect that compounds this. Reshoring and near-shoring the policy-driven attempt to bring production closer to consumption are often presented as a cure for long-haul logistics. In the very long run they may reduce ton-miles. But during the multi-year transition, they fragment volumes across more origins and more lanes, each with its own imbalance, which works against the network efficiencies that come from dense, balanced trunk routes. A world of many medium-sized, imbalanced flows can be less equipment-efficient than a world of a few enormous ones, even if the latter are themselves imbalanced.
The practical lesson for importers is that the empty-container surcharge embedded in their freight rates is, in part, a tariff cost in disguise. When trade policy redraws sourcing maps faster than the container fleet can rebalance, the cost of repositioning the resulting empties is absorbed into head-haul rates and passed down the chain. Companies modelling the landed-cost impact of a tariff change frequently capture the duty itself and miss this logistics premium entirely. It belongs in the model. A duty change that looks neutral on a spreadsheet may carry a hidden freight cost that only materialises once the equipment network strains to serve the new pattern of trade.
The Compounding Factors: Suez, Hormuz, and the Mega-Ship Era
If structural imbalance is the deep cause, several proximate forces have amplified the trend or complicated its measurement. The first and most discussed is the disruption to Red Sea routing. When carriers divert around the Cape of Good Hope rather than transit Suez, voyage distances lengthen dramatically, every box full or empty spends more time at sea, and the effective demand for vessel capacity and equipment rises. For a time it was reasonable to suspect that the rise in empty TEU-miles was largely a Red Sea artifact: longer routes mechanically inflate the mileage of every movement, empties included.
Sea-Intelligence tested exactly this hypothesis and found it wanting. By modelling a “Suez-normal” scenario in effect, asking what the figures would look like if routing returned to baseline the consultancy concluded that there is now no real distortion attributable to the Red Sea crisis in the underlying trend. The empty problem survives the removal of the routing noise. That is an important finding, because it forecloses the comforting interpretation that the surge will simply unwind when shipping lanes normalise. It will not. The imbalance is in the cargo, not the routing.
A more recent complication has come from the Strait of Hormuz. Disruption to navigation and port operations in and around the Gulf has forced carriers to improvise empty-container handling on the fly. Maersk, for example, implemented temporary empty-container return arrangements under which empties could no longer be returned to their usual locations across several Gulf states, and instead had to be funnelled to designated depots, with only limited acceptance elsewhere and steep drop-off charges attached. Those charges ranging from several hundred dollars to several thousand dollars per container depending on the depot are a vivid illustration of how quickly the cost of merely parking an empty box can escalate when the network seizes up. When a carrier is charging two or three thousand dollars to accept an empty in the wrong place, the empty has become an expensive liability in its own right.
The third compounding factor is the mega-ship era itself. The industry’s response to cost pressure over the past fifteen years has been relentless upsizing: ever-larger vessels chasing economies of scale on the trunk routes. Those economies are real for loaded cargo, but they interact badly with imbalance. A larger vessel concentrates more boxes into fewer port calls, creating sharper peaks of equipment that must then be evacuated. When a 24,000-TEU ship discharges its load at an import hub, it leaves behind a correspondingly enormous pile of boxes that will, in aggregate, need to be repositioned. The bigger the ship, the bigger the empty wave that follows it through the terminal. Scale efficiency on the water can become scale inefficiency on the land.
How Empty Repositioning Actually Works
To understand the cost, it helps to follow an empty box through its journey. When a loaded container is delivered to an inland consignee, it is unpacked and becomes available as an empty. The consignee returns it, usually to a nominated depot or terminal, often incurring detention and demurrage clocks if the return is late. From that depot the carrier must decide what to do with it. In a balanced market the box would be promptly matched to a nearby exporter and refilled. In an imbalanced market there is no nearby exporter to absorb it, and the box begins a second, unpaid journey.
That second journey is a logistics problem of considerable complexity. The carrier must aggregate empties at a port, find slot space on a vessel heading toward a deficit region, pay to load and discharge them, and store them at both ends until they are needed. Each of these steps consumes resources: drayage trucking to move the box to the port, lift charges at the terminal, vessel slot capacity that could otherwise carry paying cargo, bunker fuel proportional to the distance, and depot storage that ties up land and labour. None of it generates revenue. The empty box is pure cost from the moment it is returned until the moment it is refilled.
Carriers manage this through sophisticated equipment-control functions whose entire job is to forecast where boxes will be needed and to move them there at least cost. They use a hierarchy of tactics: first, try to match empties to local export demand; second, reposition regionally by the cheapest available mode, often barge or rail; third, reposition across oceans by deep-sea vessel as a last resort, because it is the most expensive. They also lean on leasing, returning surplus owned or leased boxes to lessors in surplus regions and picking up equipment from lessors in deficit regions, to avoid physically shipping air across the world. And they use “street turns” matching an import box directly to a nearby export load without an intervening depot trip wherever the paperwork and timing allow.
Even with these tools, the structural imbalance means a large residual of empties must simply be sailed back across the ocean. This is the irreducible core of the problem. When the imbalance widens, the residual grows, the cheaper regional options are exhausted faster, and a larger fraction of the repositioning has to be done by the most expensive method: long-haul deep-sea movement of air. That is exactly what the rising TEU-mile figure is capturing. The industry is being pushed up the cost curve of its own repositioning options, with each increment of imbalance forcing carriers from the cheap, local solutions toward the expensive, oceanic ones.
The Cost Stack: What Empty Repositioning Costs the Industry
Putting a dollar figure on empty repositioning is difficult, because the cost is distributed across many line items and rarely reported as a single number. The most widely cited estimate, from Boston Consulting Group, places the annual cost of moving empty containers in excess of twenty billion dollars, equivalent to roughly twelve percent of the shipping industry’s operating costs. Other estimates put the range somewhat lower, at fifteen to twenty billion dollars a year, representing up to eight percent of an individual carrier’s operating costs. Whichever figure one prefers, the order of magnitude is unambiguous: empty repositioning is a multi-billion-dollar, double-digit-percentage drag on the economics of liner shipping.
It is useful to decompose that headline into its components, because each maps onto a different part of the freight bill that shippers eventually pay.
A frequently overlooked point is that a meaningful share of this cost is avoidable. Industry analysis suggests that roughly thirty percent of the twenty-billion-dollar repositioning bill stems from inefficiencies poor visibility, fragmented data, siloed equipment pools, and suboptimal matching that better technology and collaboration could in principle eliminate. That implies several billion dollars a year of pure waste, distinct from the irreducible cost imposed by genuine trade imbalance. The distinction matters: the irreducible portion is a structural tax on trade, while the avoidable portion is a self-inflicted wound that the industry has so far failed to close.
The cost is also lumpy and pro-cyclical in an unhelpful way. When markets tighten and head-haul rates spike, the opportunity cost of every empty slot rises, because that slot could have carried premium-priced cargo. When markets are disrupted, drop-off and detention charges balloon, as the Gulf example shows. So the empty-box cost tends to be highest precisely when freight is already expensive, amplifying rather than smoothing the peaks that shippers experience. In a soft market the cost is hidden inside thin margins; in a tight market it bursts into the open as higher rates. Either way, it is always present.
Operational Waste: Ports, Depots, and the Land-Side Squeeze
The financial cost is only part of the waste. The empty-container surge also imposes a heavy operational burden on ports, terminals, and inland networks that are already running near capacity. Empties do not simply teleport from consignee to exporter; they occupy physical space, equipment, and labour at every stage, and they do so without contributing to the throughput metrics that justify port investment.
The director of containers at the Port of Rotterdam, Hanna Stelzel, has described the challenge candidly, noting that the growing number of empties being repositioned is not a good sign for the economy and that handling more empty containers across different terminals is a genuine operational challenge. Rotterdam’s response has been infrastructural and logistical: building a dedicated container exchange route to connect its deep-sea terminals so that empties can be shuttled between them more efficiently, extending the use of night-time hours, and leaning more heavily on barge connections to keep the system fluid. These are sensible mitigations, but they are also investments forced upon the port by a problem it did not create and cannot solve capital and operational effort diverted to managing air.
The land-side squeeze is acute because port-adjacent land is among the scarcest and most expensive real estate in the logistics chain. Every acre occupied by stacks of empties is an acre not available for productive throughput. Depots fill up, storage fees rise, and the friction propagates outward into the trucking and rail networks that must move the empties to wherever space exists. In congested gateways, the search for somewhere to put empty boxes becomes a daily operational headache, contributing to truck turn-time delays, chassis shortages, and the kind of low-grade chronic congestion that erodes reliability across the whole system.
Reliability is itself a casualty. When terminals are clogged with empties, they have less slack to absorb the inevitable shocks a bunched vessel arrival, a labour disruption, a weather event. The empty surge therefore reduces the resilience of the network at the same time as it raises its cost, leaving the system more brittle just as trade conditions have become more volatile. For shippers, this shows up as worse schedule reliability and longer, less predictable transit times, which carry their own costs in the form of larger safety stocks and missed sales.
Environmental Waste: Burning Fuel to Move Air
Perhaps the starkest way to characterise empty repositioning is that it is the deliberate, large-scale combustion of fossil fuel to move air across oceans. Container shipping already produces on the order of 940 million tonnes of carbon dioxide a year, around 2.5 percent of global emissions. A rising share of that footprint is now attributable to movements that carry no cargo and create no direct economic value emissions without output.
Sea-Intelligence has quantified the climate dimension of the imbalance directly. It calculates that the carbon footprint of a single loaded TEU-mile has risen by about eight percent compared with 2019, purely because of the worsening imbalance. The logic is straightforward: if each unit of paying cargo now drags more empty repositioning behind it, then the emissions associated with the empties must be apportioned across the loaded cargo, raising the effective footprint of every productive box. Shippers are therefore facing higher emissions per unit shipped even before any other factor is considered a quiet erosion of the decarbonisation progress the industry claims elsewhere.
This creates an awkward tension with the regulatory direction of travel. As carbon pricing and emissions regulation tighten, the cost of empty repositioning will rise further, because the fuel burned to move empties will increasingly carry an explicit price. An empty box sailing back across the Pacific is not merely an operational cost today; it is a growing carbon liability tomorrow. The imbalance, in other words, is becoming more expensive along two axes at once the direct cost of the fuel and the regulatory cost of the carbon and both of those costs will ultimately be recovered from loaded cargo.
For companies with sustainability commitments and scope-three reporting obligations, the empty-container trend has a reporting consequence as well. The emissions embedded in their inbound logistics are rising for reasons entirely outside their control, driven by a macro imbalance they cannot influence. Those who measure carefully will find their freight-related footprint creeping upward even as they optimise everything within their own four walls, and they should be prepared to explain why.
The Transmission Mechanism: How Empties Become Freight Rates
The crucial question for any shipper is how, precisely, the cost of empty repositioning ends up on their invoice. The mechanism is both simple and inescapable, and Sea-Intelligence states it directly: an increased trade imbalance means head-haul cargo must cover a proportionally larger part of the cost. The shippers on the high-volume, cargo-rich lanes ultimately bear the expense of repositioning the industry’s growing surplus of empty boxes.
The economics work like this. A carrier’s vessel makes a round trip. On the loaded head-haul leg it carries paying cargo; on the imbalanced back-haul leg it carries a mixture of cheap cargo and empties. The total cost of operating the round trip crew, fuel, capital, port charges, and the cost of moving the empties must be recovered from somewhere. Since the back-haul cannot pay its way, the head-haul must carry the burden. The greater the imbalance, the larger the share of total round-trip cost that has to be loaded onto head-haul rates. As the empty proportion rises, head-haul shippers are effectively charged not just for moving their own goods, but for sending the box back empty to be refilled.
This is why the empty-container trend is fundamentally a freight-cost story rather than merely an operational curiosity. It is a wedge driven between the cost of the round trip and the revenue available to cover it, and that wedge is widening. Every increment of imbalance forces carriers either to accept lower margins which, in a capital-intensive industry with thin and volatile returns, they cannot sustain or to raise head-haul rates to compensate. Over any reasonable horizon, the latter dominates. The cost is passed through.
It is important to recognise that this pass-through is partly hidden from view. It rarely appears as a discrete “empty repositioning surcharge” on a rate sheet. Instead it is baked into the base rate on the busy lanes, indistinguishable to the shipper from the cost of moving their own cargo. This invisibility is precisely why the trend is dangerous: it raises the structural floor under freight rates in a way that is easy to overlook and hard to negotiate away, because no single carrier can unilaterally stop repositioning its empties. The cost is systemic, and so is the pass-through.
Structural, Not Cyclical: Why This Will Not Simply Unwind
Freight markets are notoriously cyclical, and a natural reaction to any adverse trend is to assume it will revert. The empty-container surge resists that optimism for several reasons, and understanding why is essential to planning around it.
First, the driver is structural. The imbalance is rooted in the geography of production and consumption, which moves on the timescale of industrial policy and demographic change, not freight cycles. Asian export dominance, Western consumption patterns, and the relative volumes of containerisable trade between them are slow-moving forces. Nothing in the current data suggests they are about to converge.
Second, the analysis has explicitly controlled for the obvious cyclical and one-off explanations and found them insufficient. The Suez-normal modelling shows the trend is not a Red Sea artifact. The use of a twelve-month rolling average strips out seasonality. The divergence between empty growth of around 65 percent and loaded growth of around 17 percent since 2019 is far too large and too persistent to be a passing phase of the freight cycle. The baseline has moved.
Third, the amplifying forces are themselves persistent or worsening. Mega-ships are not going to shrink; the order book continues to favour scale. Trade fragmentation driven by tariffs and geopolitics is, if anything, intensifying. Carbon regulation is tightening, not loosening. Each of these makes the empty problem either larger or more expensive, and none is on a trajectory to reverse in the near term. The prudent planning assumption is that the elevated empty share is the new normal, and that the freight-cost premium it imposes is a permanent fixture rather than a temporary surcharge.
What Can Be Done: Mitigations and Their Limits
If the imbalance itself is largely beyond the industry’s control, the realistic agenda is to attack the avoidable waste the roughly thirty percent of repositioning cost attributable to inefficiency rather than to genuine imbalance. Several levers exist, though each has real limits.
The most immediate is data and visibility. A great deal of empty repositioning is wasteful because carriers, leasing companies, shippers, and depots operate with incomplete information about where boxes are and where they will be needed. Better forecasting, shared equipment pools, and digital matching platforms can increase the rate of street turns and local matches, reducing the number of empties that must be sailed across oceans. Container-trading and interchange marketplaces, in which one party’s surplus box is matched to another’s deficit, attack exactly this fragmentation. These tools are improving, but they nibble at the margin; they cannot conjure export cargo where none exists.
A second lever is physical: foldable or collapsible containers, which allow several empty boxes to be folded into the footprint of one, cutting the slot, handling, and storage cost of repositioning. The concept is sound and has been demonstrated, but adoption has been persistently slow, held back by the capital cost of the units, the labour and equipment needed to fold and unfold them, durability concerns, and the chicken-and-egg problem of building handling infrastructure for a fleet that does not yet exist. It remains a promising but marginal solution.
A third lever is network design: smarter deployment of leasing to avoid physically moving empties, better use of regional modes like barge and rail in place of deep-sea repositioning, and the kind of terminal infrastructure investment exemplified by Rotterdam’s container exchange route. These genuinely reduce cost, but they are mitigations of a symptom. The fourth and most fundamental lever reducing the imbalance itself through reshoring, regional production, and more balanced trade operates on a timescale of years to decades and, as noted earlier, can worsen the problem during the transition. None of these, individually or together, is likely to return the empty share to its old one-in-four band. The honest conclusion is that the industry can slow the bleeding and trim the waste, but it cannot cure the underlying condition, which lives in the structure of world trade.
The Shipper’s Experience: Detention, Demurrage, and Equipment Availability
For the importer or exporter on the ground, the empty-container imbalance is rarely encountered as an abstract TEU-mile statistic. It is encountered as a series of concrete frictions and charges that complicate daily operations and inflate the all-in cost of moving goods. Understanding these frictions makes the macro trend tangible and shows why the problem is felt acutely even by companies that never read a shipping-analytics report.
The first friction is detention and demurrage the family of charges that accrue when a container sits too long outside the carrier’s control or inside the terminal. In an imbalanced market these charges become both more frequent and more severe, because the underlying equipment flows are disrupted. When a carrier urgently needs its boxes back to reposition them toward a deficit region, the free time it allows for a box to remain at a consignee’s premises tightens, and the penalties for overstaying bite sooner. Shippers find themselves racing to return equipment they would prefer to unpack at a measured pace, and paying for the privilege when they cannot. These charges have grown into a significant and contentious cost category, and the empty imbalance is one of the forces pushing them upward.
The second friction is equipment availability and quality at the point of loading. Exporters in deficit regions places that import more than they export in containerisable terms periodically find that there are simply not enough empty boxes available when they need them, because the equipment has been pulled toward higher-priority head-haul lanes or has not yet been repositioned back. When boxes are scarce, exporters face delays, must accept older or lower-grade equipment, or pay premiums to secure a unit. The same imbalance that floods import gateways with surplus empties starves export origins of the boxes they need, and both sides of that mismatch cost money.
The third friction is reliability and predictability. The empty problem clogs terminals and inland networks, and the resulting congestion ripples back to the shipper as longer dwell times, missed sailings, and rolled cargo. A shipper whose container is bumped from its booked vessel because the terminal is gridlocked with empties bears a real cost: delayed revenue, dissatisfied customers, and the need to hold larger buffer inventories to insulate against unreliable transit. None of these costs appears on the freight invoice as such, but all of them are downstream consequences of an imbalanced equipment system, and all of them ultimately feed into the price of the delivered good.
The Container Leasing Market and the Economics of Box Ownership
A large share of the world’s container fleet is not owned by the shipping lines that operate it but leased from specialist leasing companies. This split ownership is central to how the industry manages and pays for the empty imbalance, and it adds a financial layer to the repositioning problem that is easy to miss when focusing only on the physical movement of boxes.
Leasing exists in part precisely because of imbalance. Rather than physically shipping an empty box thousands of miles back to where it is needed, a carrier can sometimes return a leased box to a depot in the surplus region and pick up a different leased box in the deficit region, letting the leasing company’s global pool absorb the geographic mismatch. This is, in effect, a financial substitute for physical repositioning, and it can be cheaper than sailing air across an ocean. But it is not free: leasing companies price the imbalance into their rates, charging more to supply boxes in chronically short regions and levying drop-off and pick-up charges that reflect where equipment is wanted. The cost of imbalance is thus partly transmuted from a physical shipping cost into a leasing cost, but it does not disappear.
The leasing market also shapes the incentives around fleet size. Because carriers do not want to be caught short of equipment on premium head-haul lanes, they tend to hold more boxes than a perfectly balanced system would require an inventory buffer against imbalance. A worsening imbalance therefore tends to inflate the total number of containers in circulation relative to the cargo being moved, raising the industry’s aggregate capital tied up in steel boxes. More boxes chasing the same loaded volume is, at the system level, another form of waste: capital locked into equipment that spends a growing fraction of its life empty or in transit to where it is needed.
For shippers, the practical consequence is that equipment costs and availability are themselves a function of imbalance, mediated through the leasing market. When the imbalance worsens, leasing rates and repositioning charges in deficit regions rise, and those increases find their way into the rates carriers must charge to remain whole. The leasing layer, in other words, is one more conduit through which the empty-box problem becomes a freight-rate problem and it operates whether or not any individual empty box is physically sailed home.
A Regional Anatomy of Imbalance
The empty-container burden is not distributed evenly across the world. It concentrates wherever the gap between containerisable imports and exports is widest, and a regional view helps explain both where the costs land and why certain corridors dominate the global figures. Historically, empty movements have ranged from a relatively modest share of box moves in some markets to a very large share in others, reflecting deep differences in economic structure.
Import-heavy consumer markets accumulate empties. The United States is the archetype: it imports vastly more containerised goods than it exports, so loaded boxes pour in and pile up as empties that must eventually be sent back toward Asia. Even though empties have historically been a smaller share of total US box moves than in some other regions, the sheer scale of US imports means the absolute number of empties needing evacuation is enormous, and the trans-Pacific back-haul is one of the great empty-repositioning flows of the world. Latin America presents a related pattern in several markets, where consumption of imported manufactured goods outstrips containerisable exports.
Europe sits in a more complex position. It is a large importer of Asian manufactured goods but also a substantial exporter, and intra-European flows add further complexity. Historically, empty movements have made up a comparatively large share of European box activity, and the Asia–Europe trade in particular has seen its imbalance worsen materially in the recent period. The Port of Rotterdam’s candid description of the operational strain and its investment in dedicated infrastructure to shuttle empties between terminals is a window into how acutely the imbalance is felt at Europe’s largest gateway.
Export-heavy manufacturing regions are the mirror image: they generate surplus loaded boxes outbound and must import empties to keep their factories supplied with equipment. East and Southeast Asia anchor this side of the ledger, drawing empties back from the consumption centres of the world to refill with the next wave of exports. The Middle East, meanwhile, has become a flashpoint of a different kind, where disruption around the Gulf has turned routine empty handling into a costly scramble, complete with multi-thousand-dollar drop-off charges at depots that can no longer accept boxes in the usual way. The common thread across all these regions is that the imbalance is structural to each, rooted in what they make and what they buy, and that the empty flows between them are the physical settlement of those structural differences.
Practical Recommendations for Shippers and Importers
If the elevated empty share is the new normal, the practical question for any company that moves goods is what to do about it. The trend cannot be reversed by an individual shipper, but its cost can be managed, anticipated, and in places mitigated. Several courses of action follow directly from the analysis.
First, account for the repositioning premium explicitly in landed-cost models. The cost of empty repositioning is embedded in head-haul base rates, invisible but real, and it is rising. Companies that build freight into their cost models as a stable, exogenous figure will systematically under-forecast their true landed costs on imbalanced lanes. Treating the structural freight floor as a variable that moves with trade imbalance and stress-testing sourcing decisions against it produces more accurate planning. This is especially important when evaluating tariff-driven sourcing shifts, where the logistics premium of a less-mature corridor can partly offset the duty savings that motivated the shift in the first place.
Second, manage equipment-related charges proactively. Detention and demurrage are a growing and negotiable cost category. Shippers can reduce exposure by improving the velocity of their own container handling, negotiating realistic free-time terms, and, where volumes justify it, exploring shipper-owned containers or interchange arrangements that reduce dependence on carrier equipment in chronically tight regions. The goal is to avoid being the party left holding and paying for a box that the carrier urgently wants back.
Third, value reliability, not just rate. In an imbalanced, congestion-prone system, the cheapest quoted rate is often not the cheapest delivered cost once rolled cargo, delays, and buffer inventory are counted. Shippers who weight carrier and routing decisions toward schedule reliability and who build modest, deliberate inventory buffers against predictable congestion frequently come out ahead of those who optimise on headline freight price alone. Finally, for companies with carbon-reporting obligations, it is worth recognising that inbound freight emissions are being inflated by the imbalance for reasons outside the shipper’s control, and building that reality into both reporting and any internal carbon accounting rather than being caught unaware as the footprint of each loaded box drifts upward.
A Worked Example: Tracing the Cost from Box to Basket
It helps to make the abstraction concrete by following the cost through a stylised example. Imagine a retailer importing a container of household goods from East Asia to the United States. The headline ocean freight rate quoted on that lane is not a pure reflection of the cost of carrying that one box westbound; it is a blended figure that must also recover the cost of eventually sending an empty box back eastbound, because the carrier knows that a large fraction of the equipment arriving on the loaded leg will return with nothing inside. The empty return is, in effect, pre-funded by the loaded rate.
Now suppose the imbalance worsens, as it has. The share of equipment returning empty rises, the average distance those empties travel rises, and the carrier’s per-round-trip cost of repositioning climbs. The carrier cannot recover that incremental cost from the empty leg, which by definition earns nothing, so it lifts the loaded rate. The retailer’s freight bill rises even though nothing about its own cargo, route, or service has changed. The increment is small per box, but it is persistent and it applies to every container the retailer moves on that lane, across thousands of shipments a year.
From there the cost propagates exactly as any input cost does. The retailer adds the higher freight to its landed cost of goods, applies its normal margin structure, and sets a shelf price. Some of the increase is absorbed in thinner margins, especially in competitive categories, but a substantial share is passed to the consumer, particularly when the cost increase is industry-wide and therefore affects all competitors simultaneously. An industry-wide cost shock is far more likely to reach the shelf than a cost increase affecting only one firm, because no competitor enjoys an advantage that would discipline the price rise. The empty-container premium is precisely this kind of industry-wide shock.
The lag matters as much as the magnitude. Freight is contracted ahead, inventory is bought ahead, and prices are reset periodically rather than continuously, so the pass-through from a freight increase to a shelf price plays out over months. This is why the empirical literature finds that the inflationary effect of higher shipping costs peaks around a year after the cost increase and persists well beyond it. The empty box that sails back across the Pacific today is, in a real sense, a small upward nudge to a price a consumer will pay next year.
The Macro Picture: An Imbalanced System and the Global Cost of Trade
Zooming out from the individual shipment, the empty-container trend is best understood as a rise in the friction cost of global trade itself. Every dollar spent moving an empty box is a dollar of economic activity that produces no good, delivers no service, and adds nothing to welfare except the indirect benefit of enabling the next loaded movement. It is, in the language of economics, a pure transaction cost and transaction costs are precisely what efficient trade is supposed to minimise.
For decades, containerisation drove those transaction costs steadily downward, and that decline was one of the quiet engines of globalisation. The standardised box made it cheap and reliable to move goods across the world, and falling freight costs supported the dispersion of production into long, geographically extended supply chains. The rising empty share represents a partial reversal of that trend: a structural increase in the cost of moving each unit of real cargo, working against the very efficiency that made global supply chains attractive in the first place.
This has implications beyond the freight bill. When the friction cost of trade rises, the calculus that justified locating production far from consumption shifts at the margin. Some flows that made sense when freight was cheap and balanced make less sense when freight carries a structural empty-repositioning premium. The trend therefore feeds back into the sourcing and location decisions that created the imbalance, in a loop whose net direction is hard to predict but whose existence underscores that the empty-box problem is not a narrow logistics issue but a feature of the broader trading system.
It also has distributional consequences. Because the cost is concentrated on head-haul lanes and passed to the consumers of imported goods, it falls disproportionately on import-dependent economies and on the households within them that spend the largest share of their income on traded goods. A structural tax on consumption that is levied invisibly through the freight system is, in effect, a mildly regressive cost one that does not appear in any tax code but is nonetheless paid, disproportionately, by those least able to absorb it. That is a sobering way to read a statistic that begins as a dry ratio of empty boxes to full ones.
Historical Perspective: How Containerisation Built and Then Strained Global Trade
The empty-container problem is, in a sense, the shadow side of one of the great efficiency revolutions of the twentieth century. Before the standardised container, break-bulk cargo was loaded and unloaded piece by piece, slowly and expensively, and the cost and unreliability of ocean freight acted as a brake on long-distance trade. The container changed that almost overnight, collapsing handling costs, slashing port time, and making it economical to ship goods across the world in standardised, interchangeable units. That interchangeability is exactly what makes empties such a tractable problem in good times any box can carry any cargo and exactly what makes the imbalance so visible in bad ones.
The same standardisation that enabled global supply chains also embedded the imbalance into the system. Because a container is a generic asset that must be returned to circulation, the network only works smoothly when boxes flow back to where they are needed at roughly the rate they are consumed. As long as trade was reasonably two-way, that condition held. But the very success of containerisation accelerated the concentration of manufacturing in a handful of export powerhouses, and as production concentrated, the two-way condition eroded. The system optimised for one kind of world balanced, growing, globalising trade and is now operating in another.
There is a historical irony here. The container was designed to take cost out of the system, and for half a century it did exactly that. But the globalisation it enabled produced precisely the lopsided trade geography that now puts cost back in, through the empty-repositioning premium. The technology did not fail; it succeeded so completely that it reshaped world trade into a pattern its own logistics struggle to serve efficiently. The empty box is the bill for that success, presented decades later.
Understanding this history matters because it tempers expectations about solutions. The empty-container problem will not be solved by a clever new box or a smarter algorithm alone, any more than the original break-bulk inefficiency was solved by working the docks harder. It was solved by a structural change in how goods were packaged and moved. A comparable resolution of the empty problem would require a structural change in the balance of world trade itself a far larger and slower undertaking than any operational fix, and one that lies largely outside the shipping industry’s hands.
Five Misconceptions That Obscure the Problem
Because the empty-container trend sits at the intersection of trade economics, logistics, and finance, it is widely misunderstood, and the misconceptions matter because they lead to the wrong responses. The first and most common is that the surge is a temporary by-product of recent disruptions the pandemic, the Red Sea, the Gulf that will fade as conditions normalise. The Sea-Intelligence analysis dismantles this directly: the Suez-normal modelling shows the trend survives the removal of routing distortions, and the multi-year divergence between empty and loaded growth is far too large to be cyclical noise. Treating a structural shift as a temporary one leads firms to under-provision for a cost that is here to stay.
The second misconception is that empty repositioning is fundamentally a technology problem that better software will solve. Visibility tools, matching platforms, and equipment pooling genuinely help, and they can recover a meaningful slice of the avoidable waste. But they operate on the margin of a problem whose core is the absence of return cargo, which no algorithm can manufacture. Believing that software will fix the imbalance leads to disappointment and to underinvestment in the harder structural responses.
The third misconception is that the cost falls on carriers and therefore need not concern shippers. The opposite is true. In a capital-intensive industry with thin and volatile margins, carriers cannot absorb a structural cost increase indefinitely; they pass it through to the head-haul rates that shippers pay. The cost may originate in the carrier’s repositioning ledger, but its ultimate incidence is on the buyer of freight and, beyond that, on the buyer of goods. Shippers who assume the problem is the carrier’s to bear will be surprised by the floor it puts under their rates.
The fourth misconception is that the empty problem is purely an environmental concern, a matter for sustainability reports rather than finance teams. The carbon dimension is real and growing, but the financial dimension is at least as large and more immediate. The two are converging as carbon pricing turns emissions into explicit cost, but to file the empty-container trend under environmental, social, and governance reporting alone is to miss the multi-billion-dollar operating-cost and freight-rate story sitting alongside it.
The fifth misconception is that the figures are too uncertain to act on. It is true that the precise dollar cost of empty repositioning is hard to pin down and that estimates vary. But the direction and order of magnitude are not in doubt: the empty share has risen substantially, the cost runs into the tens of billions annually, and it is transmitted to freight rates and onward to prices. Waiting for perfect precision before incorporating the trend into planning is itself a decision and, given the persistence of the trend, a costly one. The responsible course is to plan around the robust central estimate rather than to treat genuine but bounded uncertainty as a reason for inaction.
Conclusion: The Cost, the Waste, and the Bill the Consumer Pays
Step back and the empty-container surge resolves into a simple but uncomfortable picture. Nearly a third of the containers crossing the world’s oceans today carry nothing. Measured by the work that actually consumes fuel and capacity TEU-miles empties now account for around 30 percent of all shipping activity and, on the loaded-comparison basis, more than 40 percent of full TEU-miles. The volume of empties needing repositioning has grown nearly four times faster than loaded trade since 2019. And the analysis is clear that this is not a passing distortion to be unwound when the Red Sea reopens or the freight cycle turns; it is a structural feature of an increasingly imbalanced trading world.
The waste embedded in that picture is staggering when tallied. Financially, empty repositioning costs the liner industry on the order of fifteen to twenty billion dollars a year a sum equivalent to a double-digit share of carriers’ operating costs of which several billion is pure, avoidable inefficiency. Operationally, it consumes scarce port land, terminal equipment, drayage capacity, and depot space, degrading reliability and resilience across a network that is already stretched. Environmentally, it burns fuel and emits carbon to move air, raising the footprint of every loaded box by around eight percent relative to 2019 and quietly undermining the industry’s decarbonisation narrative. It is, in the most literal sense, a vast and growing exercise in moving nothing, at great cost, in every dimension that matters.
None of this cost stays with the carriers. The transmission mechanism is direct and well understood: because the imbalanced back-haul cannot pay its way, the cost of the round trip including the cost of repositioning the empties is loaded onto the head-haul rates charged on the busy, cargo-rich lanes. Sea-Intelligence is explicit that head-haul shippers ultimately bear the expense of repositioning the industry’s surplus empties. Those shippers are the importers, manufacturers, and retailers who move the world’s goods, and they do not absorb the cost either. They pass it into their landed costs, their wholesale prices, and ultimately the shelf price paid by the consumer.
The final link in the chain is the one that should concern policymakers and the public most, and it is quantifiable. Research on the pass-through from ocean freight to consumer prices is now substantial. The International Monetary Fund has found that when freight rates double, inflation picks up by roughly 0.7 percentage points, with the effect peaking after about a year and persisting for up to eighteen months. OECD analysis finds that a ten-percentage-point increase in container shipping inflation raises manufactured-goods import-price inflation by around 0.2 percentage points in the major G20 economies within the same quarter, with effects on headline inflation peaking roughly a year later. Freight cost is not a closed-loop concern of the shipping industry; it is a measurable input into the price of nearly every traded good, transmitted to households with a lag of months to over a year.
Set those findings against the empty-container trend and the conclusion writes itself. A structural increase in the empty share raises the floor under head-haul freight rates. Higher freight rates pass into import prices and, with a lag, into consumer inflation. The empty box on the back-haul of a trans-Pacific voyage is therefore not an obscure operational statistic it is a small, persistent upward pressure on the price of goods, paid by every household that buys imported products. Multiply that pressure across tens of millions of empty moves a year and a multi-billion-dollar annual cost base, and the empty-container problem reveals itself as what it truly is: a structural tax on consumption, levied invisibly through the freight system, that grows larger as the world’s trade becomes more imbalanced.
For the firms that advise on trade on tariffs, sourcing, and landed cost the implication is concrete. The empty-repositioning premium belongs in the cost models. It is part of the true price of a fragmented, imbalanced trading system, and it is rising. Those who account for it will price and plan more accurately than those who treat freight as a stable, exogenous line item. The boxes may be empty, but the cost they carry is very real, and in the end it lands, as such costs always do, on the consumer.